Reishi Extract Suppliers & Manufacturers
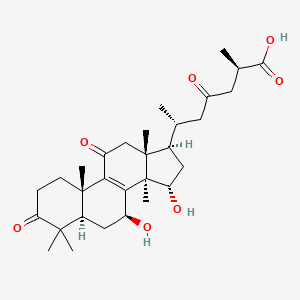
Identifiers
Functions
What does available trade activity indicate for Reishi extract?
Reishi extract is classified under HS Code 1302.19. This falls under Chapter 13: Lac; gums, resins and other vegetable saps and extracts, specifically Heading 1302 (Vegetable saps and extracts; pectic substances, pectinates and pectates; agar-agar and other mucilages and thickeners, whether or not modified, derived from vegetable products), under subheading: Vegetable saps and extracts; n.e.c. in item no. 1302.1.
* The data below is specific to the HS code, not the ingredient.
Suppliers
1,393
Across 76 countries
Shipments
10,957
from 2015 to 2026
Total weight
165.3M kg
15,939 TEU · standard 20-foot container units
Last shipment
8 months ago
Last updated at Feb 25, 2026
Growth
↑ 45%
Trade under 1302.19 has increased by 45% over the past 6 months
What does trade activity suggest about the Reishi Extract supply chain?
Trade activity under HS 1302.19 shows a large, active supply chain with 1,393 suppliers, 10,957 shipments, and 165 million kg moved since 2015. The growth score of 49.6 indicates moderate recent momentum. However, this HS code covers all vegetable saps and extracts, so the volume is not reishi-specific. The presence of major botanical extract houses (e.g., Omniactive, Naturex, Schwabe) suggests reishi is part of a broader extract trade, but the data cannot isolate reishi volumes. For formulation planning, treat this as evidence of a robust extract supply ecosystem, not a reishi-specific market size.
What does the HS or HTS classification include, and where are its limits for Reishi Extract?
HS 1302.19 covers 'Vegetable saps and extracts; n.e.c. in item no. 1302.1', which includes a wide range of plant-derived extracts beyond reishi. The classification is broad, capturing ginseng, coffee/tea extracts, and other botanicals, as evidenced by suppliers like Korea Ginseng and Jacobs Douwe Egberts. This means the trade data is a proxy for the extract sector, not a precise reishi measure. For regulatory or sourcing decisions, you cannot assume any shipment under this code is reishi; further product-level verification is required to confirm ingredient identity.
Which suppliers are associated with Reishi extract trade?
| Supplier | Shipments | Top customer | Growth | Last shipment | |
|---|---|---|---|---|---|
No suppliers found. | |||||
How concentrated or diversified does the supplier landscape appear for Reishi Extract?
The supplier landscape is highly diversified, with 1,393 suppliers across 76 countries, but a few large players dominate shipment counts. Omniactive (195 shipments), Chile Botanics (179), and Schwabe Extracta (89) are prominent, while many suppliers have fewer than 20 shipments. This suggests a fragmented market with some concentration among established extract houses. For procurement, this means multiple sourcing options exist, but the top suppliers likely offer scale and reliability. However, since the data is not reishi-specific, the actual concentration for reishi extract could differ.
Which supply risks or dependencies around Reishi Extract require further diligence?
Key supply risks include the inability to confirm reishi-specific volumes due to the broad HS classification, and the presence of non-manufacturing entities like logistics firms and trading companies in the data. Some suppliers show zero recent growth (e.g., Thu Nga, Top Flavours), indicating potential supply instability. Additionally, the mix of food/beverage and flavor suppliers (e.g., Muntons, IFF) suggests that reishi may be sourced alongside other extracts, complicating traceability. Further diligence should verify supplier specialization in reishi and assess continuity of supply for those with declining activity.
Which sourcing geographies and trade lanes appear most relevant to Reishi Extract?
China, India, and Mexico are the top sourcing countries by supplier count and shipment volume, with China (229 suppliers, 1,699 shipments) and India (186 suppliers, 1,576 shipments) leading. Brazil and Germany also show significant weight, indicating strong European and Latin American lanes. The presence of suppliers in Korea, Japan, and Vietnam suggests Asian trade lanes are relevant. However, because the HS code is broad, these geographies represent general extract trade, not reishi-specific origins. For reishi sourcing, China and India are likely key, but confirm product-level data before committing.
Which countries drive Reishi extract trade activity?
By shipment count
China
1,699 shipments
229 suppliers
14.2M kg total weight
India
1,576 shipments
186 suppliers
14.7M kg total weight
Mexico
880 shipments
105 suppliers
17.3M kg total weight
France
816 shipments
87 suppliers
3.7M kg total weight
Germany
701 shipments
70 suppliers
14.8M kg total weight
South Korea
612 shipments
121 suppliers
3.1M kg total weight
Brazil
560 shipments
69 suppliers
31.4M kg total weight
Spain
409 shipments
60 suppliers
2.4M kg total weight
Chile
404 shipments
21 suppliers
3.3M kg total weight
Thailand
397 shipments
2 suppliers
6M kg total weight