Collagen Peptides Suppliers & Manufacturers
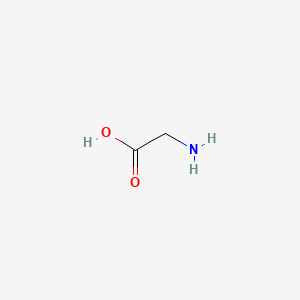
Identifiers
Functions
What does available trade activity indicate for Collagen peptides?
Collagen peptides is classified under HS Code 2922.49. This falls under Chapter 29: Organic chemicals, specifically Heading 2922 (Oxygen-function amino-compounds), under subheading: Amino-acids, other than those containing more than one kind of oxygen function, their esters; salts thereof, excluding lysine, glutamic acid, anthranalic acid and tilidine, their esters and salts thereof.
* The data below is specific to the HS code, not the ingredient.
Suppliers
5,988
Across 113 countries
Shipments
30,322
from 2015 to 2026
Total weight
1B kg
73,775 TEU · standard 20-foot container units
Last shipment
8 months ago
Last updated at Feb 25, 2026
Growth
↑ 51%
Trade under 2922.49 has increased by 51% over the past 6 months
What does trade activity suggest about the Collagen peptides supply chain?
Trade activity under HS 3504 indicates a large, active supply chain for protein substances and derivatives, with 780 suppliers, 11,765 shipments, and 269.7 million kg moved since 2015. Brazil, Belgium, China, and Australia lead in shipment volume, suggesting established production and export hubs. However, this classification is broad and includes gelatin, other protein hydrolysates, and industrial products, so the data does not confirm that all activity is collagen peptides. The presence of major gelatin and protein processors like Rousselot, JBS, and Dezhou-based firms suggests significant capacity relevant to collagen sourcing, but ingredient-specific verification is required.
What does the HS or HTS classification include, and where are its limits for Collagen peptides?
HS code 3504 covers peptones, their derivatives, other protein substances and derivatives not elsewhere specified, and hide powder, whether or not chromed. This includes gelatin and collagen derivatives but also encompasses non-food-grade gelatins, industrial adhesives, casings, and other protein-based products. Consequently, the trade data reflects a broad category, not exclusively collagen peptides. Suppliers such as starch producers and logistics firms appear, indicating the classification captures upstream raw materials and intermediate goods. For collagen peptide-specific analysis, additional product-level data is necessary to isolate the ingredient from the wider protein and gelatin trade.
Which suppliers are associated with Collagen peptides trade?
| Supplier | Shipments | Top customer | Growth | Last shipment | |
|---|---|---|---|---|---|
No suppliers found. | |||||
How concentrated or diversified does the supplier landscape appear for Collagen peptides?
The supplier landscape appears moderately concentrated, with a few large players dominating shipment volumes. Rousselot (Brazil and Belgium), Gelco, and JBS account for a significant share of shipments, while the top 10 suppliers represent roughly 40% of total shipments. However, the presence of 780 suppliers across 55 countries indicates a diversified base, with many smaller regional players. This mix suggests that while a handful of established gelatin and protein processors hold substantial market presence, there is room for niche and regional suppliers, particularly in China and Europe, to serve specialized collagen peptide demand.
Which supply risks or dependencies around Collagen peptides require further diligence?
Key supply risks include reliance on a few large suppliers for high-volume trade, potential for non-ingredient-specific shipments under HS 3504, and the presence of suppliers with inactive or declining shipment patterns. For example, several suppliers show zero growth in recent periods, indicating possible supply instability. Additionally, the broad classification means that some high-volume suppliers may not actually provide collagen peptides, necessitating product-level verification. Geographic concentration in Brazil and China could expose the supply chain to regional disruptions, and the lack of destination data limits visibility into end-market dependencies.
Which sourcing geographies and trade lanes appear most relevant to Collagen peptides?
Brazil, Belgium, China, and Australia are the most prominent sourcing geographies by shipment volume and weight, with Brazil and Belgium leading in shipments and Belgium and Australia in total weight. China has the highest supplier count (219), indicating a fragmented supply base. Key trade lanes appear to connect these origins to major markets, with notable intra-company flows (e.g., Rousselot Brazil to Rousselot, Nitta Gelatin to its US subsidiary). This suggests a global supply chain with regional production hubs, but the data does not specify destination countries, so end-market lanes remain inferred rather than confirmed.
Which countries drive Collagen peptides trade activity?
By shipment count
China
7,816 shipments
1,986 suppliers
208.9M kg total weight
India
4,323 shipments
378 suppliers
62.6M kg total weight
Italy
3,195 shipments
256 suppliers
66.1M kg total weight
Japan
1,202 shipments
213 suppliers
74.9M kg total weight
Belgium
1,138 shipments
198 suppliers
28.9M kg total weight
Vietnam
1,060 shipments
242 suppliers
34.1M kg total weight
South Korea
997 shipments
220 suppliers
37.1M kg total weight
Germany
894 shipments
223 suppliers
17.1M kg total weight
Netherlands
670 shipments
83 suppliers
16.4M kg total weight
Taiwan
624 shipments
202 suppliers
19.3M kg total weight