Silica Gel Suppliers & Manufacturers
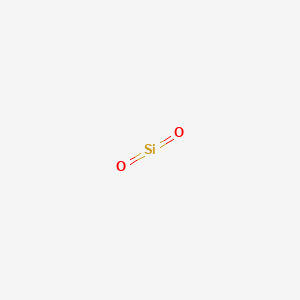
Identifiers
Functions
What does available trade activity indicate for Silica gel?
Silica gel is classified under HS Code 2505.10. This falls under Chapter 25: Salt; sulphur; earths, stone; plastering materials, lime and cement, specifically Heading 2505 (Sands of all kinds; natural, whether or not coloured, other than metal-bearing sands of chapter 26), under subheading: Sands; natural, silica and quartz sands, whether or not coloured.
* The data below is specific to the HS code, not the ingredient.
Suppliers
746
Across 59 countries
Shipments
6,068
from 2015 to 2026
Total weight
457.9M kg
21,767 TEU · standard 20-foot container units
Last shipment
8 months ago
Last updated at Feb 25, 2026
Growth
↑ 42%
Trade under 2505.10 has increased by 42% over the past 6 months
What does trade activity suggest about the silica gel supply chain?
Trade activity under HS 2505.10 indicates a large, active siliceous materials supply chain, with 746 suppliers, 6,068 shipments, and roughly 458 million kg moved between 2015 and 2026. The growth score of 46.2 suggests moderate recent momentum. This is not silica-gel-specific evidence; the code covers natural silica and quartz sands, so the volume reflects broader industrial minerals, including construction, glass, and foundry inputs. For formulation planning, treat this as a signal of raw sand availability, not desiccant-grade silica gel supply. The presence of logistics firms and fiberglass producers among suppliers confirms the code captures diverse downstream uses, so further product-level verification is required before sourcing decisions.
What does the HS or HTS classification include, and where are its limits for silica gel?
HS code 2505.10 covers natural silica sands and quartz sands, whether or not colored, under Chapter 25 for earths and sands. This classification scope is broad: it includes raw mineral sands used in glassmaking, construction, and metallurgy, but it does not specifically cover processed silica gel, which is a manufactured amorphous form of silicon dioxide. The match to silica gel is inferred, not confirmed, meaning supplier activity under this code may involve sand mining, trading, or unrelated industrial uses. The key limit is that this code cannot distinguish desiccant-grade silica gel from foundry sand or quartz feedstock, so any supply-chain conclusion must be validated with product specifications.
Which suppliers are associated with Silica gel trade?
| Supplier | Shipments | Top customer | Growth | Last shipment | |
|---|---|---|---|---|---|
No suppliers found. | |||||
How concentrated or diversified does the supplier landscape appear for silica gel?
The supplier landscape appears fragmented but with a long tail: 746 total suppliers, yet only a handful show high shipment counts. China's 285 suppliers account for 38% of the total, indicating a concentrated geographic base but diversified individual players. Top suppliers like Silikal (347 shipments) and Weihai Pearl Silica Gel (311 shipments) suggest some consolidation at the top, but most suppliers have fewer than 20 shipments, pointing to a competitive, dispersed market. This structure implies multiple sourcing options but also variability in reliability and product quality. For procurement, the top-tier suppliers may offer scale, but the data does not confirm they manufacture silica gel specifically, so supplier qualification remains essential.
Which supply risks or dependencies around silica gel require further diligence?
The primary supply risk is product misidentification: HS 2505.10 includes natural sands, so a supplier shipping under this code may provide quartz sand, glass-grade silica, or fiberglass feedstock rather than silica gel. Notable examples include fiberglass producers and logistics firms in the supplier list, which are not silica gel manufacturers. Additionally, several high-volume suppliers show no recent shipments (growth score of 0), indicating potential supply interruptions or business changes. China's dominance creates geographic concentration risk, while the presence of traders like Henan Xunyu Chemical adds intermediary risk. Further diligence should verify each supplier's actual product line, manufacturing capability, and quality certifications before engagement.
Which sourcing geographies and trade lanes appear most relevant to silica gel?
China dominates the trade landscape with 285 suppliers and 2,549 shipments, representing the largest sourcing geography by far. Germany follows with 60 suppliers and 850 shipments, while Japan, South Korea, and India show meaningful but smaller activity. Canada and Belgium stand out for high weight volumes despite fewer shipments, suggesting bulk mineral exports. The most relevant lanes appear to be China-to-global and Germany-to-global, with notable intra-Asia flows to Japan and Korea. For sourcing strategy, China offers the deepest supplier pool, but the data does not confirm these are silica gel producers; many may be sand exporters. European suppliers like Germany provide an alternative, higher-cost lane with established chemical firms.
Which countries drive Silica gel trade activity?
By shipment count
China
2,549 shipments
285 suppliers
136.8M kg total weight
Germany
850 shipments
60 suppliers
19.9M kg total weight
Japan
409 shipments
30 suppliers
6.6M kg total weight
United Kingdom
330 shipments
17 suppliers
4.9M kg total weight
South Korea
278 shipments
29 suppliers
34.5M kg total weight
India
253 shipments
36 suppliers
11.2M kg total weight
Taiwan
209 shipments
10 suppliers
14.5M kg total weight
Belgium
208 shipments
16 suppliers
27.9M kg total weight
Italy
160 shipments
29 suppliers
3.3M kg total weight
France
142 shipments
27 suppliers
3.4M kg total weight