Silicon Oxide Suppliers & Manufacturers
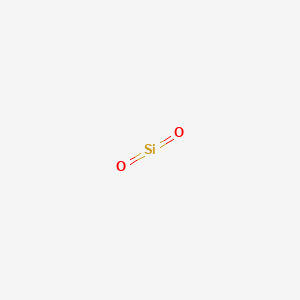
Identifiers
Functions
What does available trade activity indicate for Silicon oxide?
Silicon oxide is classified under HS Code 2505.10. This falls under Chapter 25: Salt; sulphur; earths, stone; plastering materials, lime and cement, specifically Heading 2505 (Sands of all kinds; natural, whether or not coloured, other than metal-bearing sands of chapter 26), under subheading: Sands; natural, silica and quartz sands, whether or not coloured.
* The data below is specific to the HS code, not the ingredient.
Suppliers
746
Across 59 countries
Shipments
6,068
from 2015 to 2026
Total weight
457.9M kg
21,767 TEU · standard 20-foot container units
Last shipment
8 months ago
Last updated at Feb 25, 2026
Growth
↑ 42%
Trade under 2505.10 has increased by 42% over the past 6 months
What does trade activity suggest about the silicon oxide supply chain?
Trade activity under HS 2505.10 indicates a large, active supply chain for silica and quartz sands, with 746 suppliers, 6,068 shipments, and roughly 458 million kg moved between 2015 and early 2026. The growth score of 46.2 over the recent 180-day period suggests moderate momentum. This scale implies a mature, high-volume market serving multiple downstream industries, not just silicon oxide ingredient buyers. For formulation planning, this means raw material availability is generally robust, but the data cannot confirm that any specific shipment is silicon oxide rather than other sand products, so volume commitments should be validated with suppliers directly.
What does the HS or HTS classification include, and where are its limits for silicon oxide?
HS code 2505.10 covers natural silica sands and quartz sands, whether or not colored, under Chapter 25 for earths and stone. This classification is broad: it includes industrial sands, construction aggregates, and quartz-based materials, but excludes metal-bearing sands of Chapter 26 and refined chemical forms of silicon oxide. The practical limit is that supplier activity under this code reflects raw mineral trade, not necessarily purified silicon oxide ingredients. For research and procurement, this means the data provides supply-chain context for sand-based feedstocks, but cannot be used to infer availability, pricing, or quality of specialty silicon oxide grades without additional product-level verification.
Which suppliers are associated with Silicon oxide trade?
| Supplier | Shipments | Top customer | Growth | Last shipment | |
|---|---|---|---|---|---|
No suppliers found. | |||||
How concentrated or diversified does the supplier landscape appear for silicon oxide?
The supplier landscape appears fragmented yet with a notable concentration among top players. The 746 total suppliers include major mineral traders like Sibelco and Quartzwerke, chemical manufacturers such as Wacker Chemicals China and Evonik Wellink Silica Nanping, and many smaller entities, including distributors and logistics firms. The top suppliers by shipment count—Silikal (347), Wacker Chemicals China (344), and Weihai Pearl Silica Gel (311)—account for a significant share of activity, suggesting moderate concentration. However, the presence of diverse, unrelated entities (e.g., Pure Farms Organic India) indicates the HS code captures a wide range of participants. For buyers, this means multiple sourcing options exist, but verifying each supplier's actual silicon oxide capability is essential.
Which supply risks or dependencies around silicon oxide require further diligence?
Key supply risks include potential over-reliance on China, which hosts 38% of suppliers and 42% of shipments, creating geographic concentration risk. Additionally, several high-volume suppliers (e.g., Silikal, Wacker) likely handle products beyond silicon oxide, so supply continuity for the specific ingredient may be less certain than shipment counts suggest. The presence of inactive suppliers—such as Yichang Huifu Silicon Material with no recent shipments since 2019—indicates churn. Further diligence should verify each supplier's product specifications, quality certifications, and whether they produce silicon oxide or merely trade sand. Regulatory compliance for sand imports, including environmental and customs requirements, also warrants review given the broad classification scope.
Which sourcing geographies and trade lanes appear most relevant to silicon oxide?
China dominates the sourcing landscape with 285 suppliers and 2,549 shipments, representing the largest share of activity, followed by Germany (60 suppliers, 850 shipments) and Japan (30 suppliers, 409 shipments). Other notable lanes include South Korea, India, Taiwan, and Belgium, with Canada showing high weight volume (138.7 million kg) despite fewer shipments. This suggests a diversified global network with Asia as the primary hub and Europe as a secondary source. For supply-chain resilience, buyers should consider dual-sourcing from China and either Germany or North America to mitigate regional disruption risks, though the data does not specify which lanes carry silicon oxide specifically versus other sand products.
Which countries drive Silicon oxide trade activity?
By shipment count
China
2,549 shipments
285 suppliers
136.8M kg total weight
Germany
850 shipments
60 suppliers
19.9M kg total weight
Japan
409 shipments
30 suppliers
6.6M kg total weight
United Kingdom
330 shipments
17 suppliers
4.9M kg total weight
South Korea
278 shipments
29 suppliers
34.5M kg total weight
India
253 shipments
36 suppliers
11.2M kg total weight
Taiwan
209 shipments
10 suppliers
14.5M kg total weight
Belgium
208 shipments
16 suppliers
27.9M kg total weight
Italy
160 shipments
29 suppliers
3.3M kg total weight
France
142 shipments
27 suppliers
3.4M kg total weight