Biotin Suppliers & Manufacturers
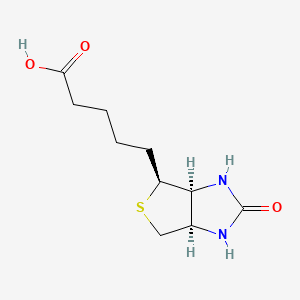
Identifiers
Functions
What does available trade activity indicate for Biotin?
Biotin is classified under HS Code 2936.29. This falls under Chapter 29: Organic chemicals, specifically Heading 2936 (Provitamins, vitamins; natural or reproduced by synthesis (including natural concentrates) derivatives thereof used as vitamins, and intermixtures of the fore-going, whether or not in any solvent), under subheading: Vitamins; n.e.c. in item no. 2936.2, and their derivatives, unmixed.
* The data below is specific to the HS code, not the ingredient.
Suppliers
491
Across 56 countries
Shipments
3,616
from 2015 to 2026
Total weight
73.9M kg
7,407 TEU · standard 20-foot container units
Last shipment
8 months ago
Last updated at Feb 25, 2026
Growth
↑ 39%
Trade under 2936.29 has increased by 39% over the past 6 months
What does trade activity suggest about the biotin supply chain?
Trade activity under HS code 2936.29 indicates a large, active supply chain with 491 suppliers and over 3,600 shipments, but this is not ingredient-specific to biotin. The data suggests robust trade flows, with recent shipments from major suppliers like Lonza Guangzhou Nansha and Jubilant Ingrevia, pointing to ongoing demand. However, the classification covers all vitamins and derivatives, so the volume cannot be attributed solely to biotin. This implies that while the supply chain is substantial, the specific biotin segment may be smaller than the aggregate suggests, and procurement strategies should account for this broader scope.
What does the HS or HTS classification include, and where are its limits for biotin?
HS code 2936.29 covers 'Other vitamins and their derivatives,' and the HTS code 2936.29.50.30 further specifies unmixed vitamins not elsewhere classified. This scope includes a wide range of vitamin products, not just biotin, and may also capture derivatives and intermixtures. The limit is that trade data under this code cannot isolate biotin-specific shipments, so any analysis of volumes or supplier activity is indicative of the broader vitamin category. This means that while the data provides useful supply-chain context, it cannot confirm biotin-specific trends or volumes without additional product-level data.
Which suppliers are associated with Biotin trade?
| Supplier | Shipments | Top customer | Growth | Last shipment | |
|---|---|---|---|---|---|
No suppliers found. | |||||
How concentrated or diversified does the supplier landscape appear for biotin?
The supplier landscape under HS 2936.29 appears moderately concentrated, with a few large suppliers handling a significant share of shipments. For example, Lonza Guangzhou Nansha (295 shipments), Jubilant Life Sciences (286), and Jubilant Ingrevia (269) are top suppliers, indicating that a handful of players dominate. However, the presence of 491 total suppliers suggests a diversified base, including many smaller traders and logistics providers. This mix implies that while there are key strategic partners, the market also has numerous alternatives, which could offer flexibility but also variability in quality and reliability. For biotin specifically, the concentration may differ, but the overall structure suggests a competitive landscape.
Which supply risks or dependencies around biotin require further diligence?
Key supply risks include heavy reliance on China and India for production, as seen in the trade data, which could expose the supply chain to regional disruptions such as regulatory changes or logistics issues. Additionally, the broad HS classification means that some suppliers may not actually produce biotin, creating a risk of misidentification. Several suppliers show zero growth or old shipment dates, indicating potential inactivity or historical records that need verification. Further diligence should confirm which suppliers are actual biotin manufacturers, assess their production capacity, and evaluate geopolitical or trade policy risks in the dominant sourcing regions.
Which sourcing geographies and trade lanes appear most relevant to biotin?
China and India dominate the trade activity under HS 2936.29, with China having 211 suppliers and 1,718 shipments, and India 63 suppliers and 1,091 shipments. These two countries account for the majority of the volume, suggesting they are primary sourcing geographies. Belgium also appears significant with 16 suppliers and 216 shipments, likely serving as a European distribution hub. The trade lanes appear to be heavily Asia-to-North America, given top customers like Glanbia Nutritionals and Provimi North America. This indicates that biotin sourcing, if aligned with this pattern, would likely rely on Chinese and Indian manufacturers, with potential supply chain risks related to regional concentration.
Which countries drive Biotin trade activity?
By shipment count
China
1,718 shipments
211 suppliers
27.7M kg total weight
India
1,091 shipments
63 suppliers
27.6M kg total weight
Belgium
216 shipments
16 suppliers
4.1M kg total weight
United Kingdom
111 shipments
15 suppliers
128.8K kg total weight
Japan
73 shipments
6 suppliers
51.8K kg total weight
Canada
71 shipments
43 suppliers
1.2M kg total weight
Australia
45 shipments
9 suppliers
6.6M kg total weight
Germany
30 shipments
15 suppliers
142.4K kg total weight
Indonesia
29 shipments
2 suppliers
1.4M kg total weight
Netherlands Antilles
22 shipments
3 suppliers
160.8K kg total weight