Potassium Permanganate Suppliers & Manufacturers
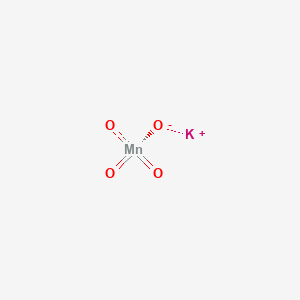
Identifiers
Hazards


What does available trade activity indicate for Potassium permanganate?
Potassium permanganate is classified under HS Code 2841.61. This falls under Chapter 28: Inorganic chemicals; organic and inorganic compounds of precious metals; of rare earth metals, of radio-active elements and of isotopes, specifically Heading 2841 (Salts of oxometallic or peroxometallic acids), under subheading: Salts; of oxometallic or peroxometallic acids, manganites, manganates and permanganates, potassium permanganate.
* The data below is specific to the HS code, not the ingredient.
Suppliers
373
Across 39 countries
Shipments
2,580
from 2015 to 2026
Total weight
491.8M kg
5,416 TEU · standard 20-foot container units
Last shipment
8 months ago
Last updated at Feb 25, 2026
Growth
↑ 37%
Trade under 2841.61 has increased by 37% over the past 6 months
What does trade activity suggest about the potassium permanganate supply chain?
Trade activity under HS code 2841.61 shows a large, active supply chain with 373 suppliers, 2,580 shipments, and roughly 491,810 metric tons of goods moving between 2015 and early 2026. The recent growth score of 41.1 indicates moderate momentum in the last 180 days. However, this data is not ingredient-specific; it reflects all goods classified under this code, which includes related inorganic chemicals. The presence of pharmaceutical companies and industrial users suggests the code covers diverse applications, so the volume cannot be attributed solely to potassium permanganate. This context is useful for gauging market scale but requires verification for ingredient-level planning.
What does the HS or HTS classification include, and where are its limits for potassium permanganate?
The classification covers HS code 2841.61 and HTS code 2841.61.00.00, described as potassium permanganate under the broader heading of salts of oxometallic or peroxometallic acids. The scope includes manganites, manganates, and permanganates, meaning the code is not exclusive to potassium permanganate. Supplier activity under this code may include related inorganic chemicals, pharmaceutical intermediates, or industrial oxidants. The key limitation is that trade data under this classification cannot confirm that any specific shipment contains potassium permanganate, so volume and supplier counts represent the broader category, not the single ingredient.
Which suppliers are associated with Potassium permanganate trade?
| Supplier | Shipments | Top customer | Growth | Last shipment | |
|---|---|---|---|---|---|
No suppliers found. | |||||
How concentrated or diversified does the supplier landscape appear for potassium permanganate?
The supplier landscape appears highly diversified, with 373 distinct suppliers across 39 countries, indicating a fragmented market rather than a concentrated one. The top suppliers by shipment count include Aurobindo Pharma (214), Zhejiang Huahai Pharmaceutical (158), and Organic Industries (122), but these are primarily pharmaceutical entities, suggesting their shipments may cover broader chemical categories. The presence of many small suppliers with 1-5 shipments indicates a long tail of niche or occasional traders. This diversification reduces single-source dependency risk but complicates supplier qualification, as many entities may not be dedicated potassium permanganate producers.
Which supply risks or dependencies around potassium permanganate require further diligence?
Key risks include the lack of ingredient-specific shipment confirmation, as the HS code covers related permanganate salts and broader chemical categories. Several major suppliers show zero growth or stale data (e.g., Universal Chemicals with no recent shipments), indicating potential supply instability. The presence of pharmaceutical entities suggests some shipments may be for drug manufacturing rather than bulk chemical supply, creating quality and specification uncertainties. Additionally, some suppliers are linked to specialized applications like pyrotechnics or batteries, which may not meet water-treatment or pharmaceutical-grade requirements. Further diligence should verify each supplier's actual product portfolio, manufacturing capability, and recent activity.
Which sourcing geographies and trade lanes appear most relevant to potassium permanganate?
China and India dominate the supplier landscape, with 157 and 58 suppliers respectively, accounting for the majority of shipments (988 and 940). Other notable sources include Germany, Taiwan, Belgium, and Italy, each with 7-15 suppliers. Chile shows a large weight figure (416,318,813 kg) but only 16 shipments, suggesting bulk industrial cargo that may not be ingredient-specific. Trade lanes appear concentrated in Asia-to-global routes, with European suppliers serving regional markets. For sourcing strategy, China and India offer the most active and diverse lanes, while other geographies provide niche or specialized supply options.
Which countries drive Potassium permanganate trade activity?
By shipment count
China
988 shipments
157 suppliers
25.7M kg total weight
India
940 shipments
58 suppliers
14.4M kg total weight
Germany
76 shipments
15 suppliers
1.6M kg total weight
Taiwan
69 shipments
7 suppliers
4.7M kg total weight
Belgium
56 shipments
12 suppliers
10M kg total weight
Italy
54 shipments
15 suppliers
918.1K kg total weight
Japan
50 shipments
9 suppliers
378.4K kg total weight
Thailand
49 shipments
2 suppliers
642K kg total weight
Egypt
44 shipments
4 suppliers
9.2M kg total weight
South Korea
32 shipments
13 suppliers
1.6M kg total weight